財務ハイライト
-
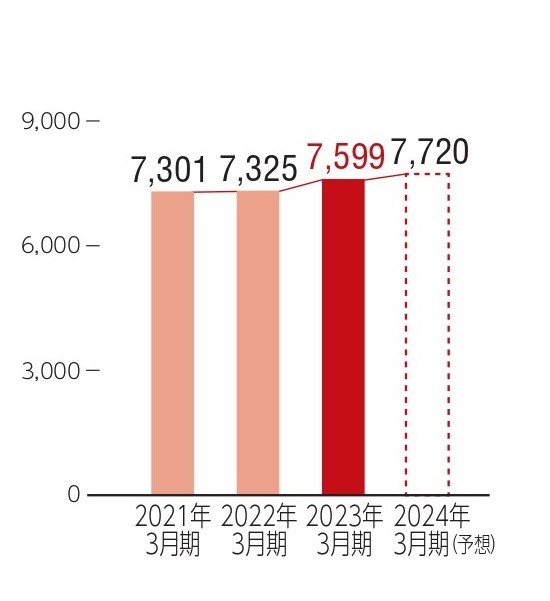
営業収益(億円)
-
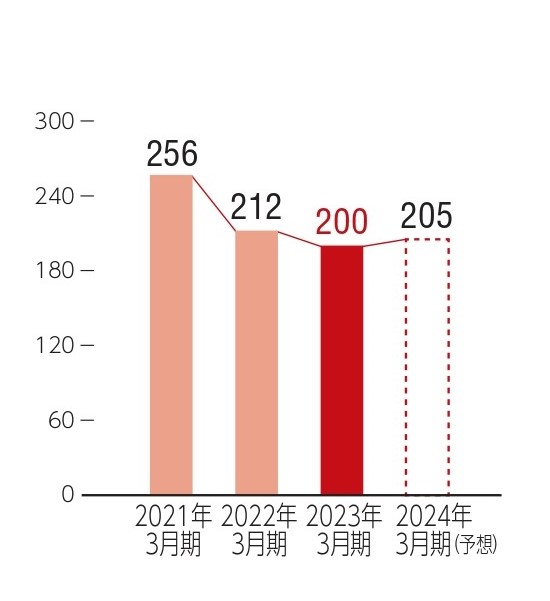
営業利益(億円)
-
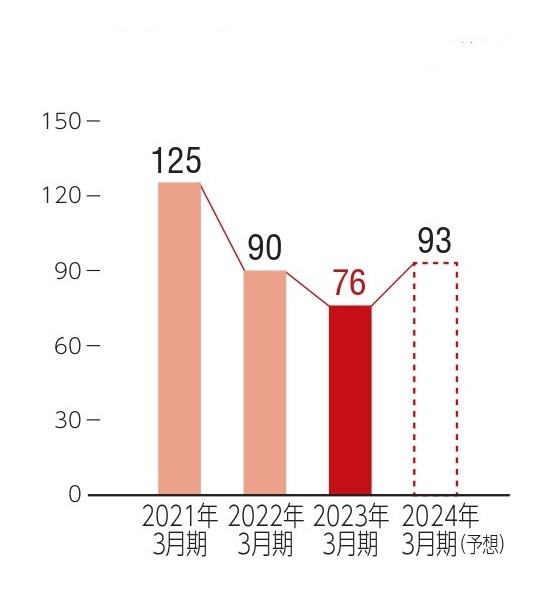
親会社株主に帰属する当期純利益(億円)
-
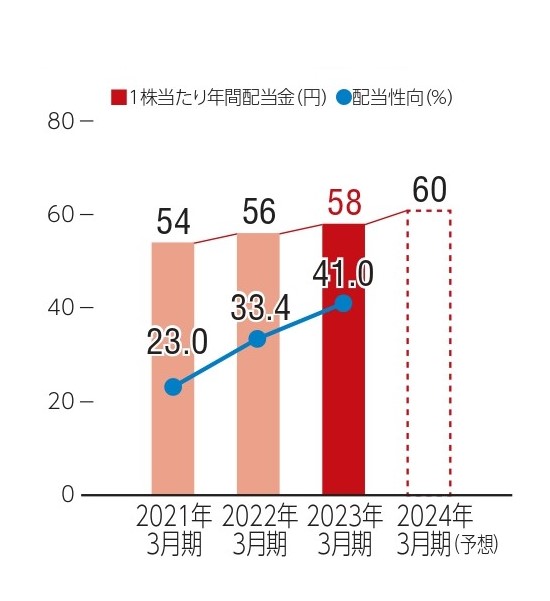
1株当たり年間配当金・配当性向
-
財務状況(億円)
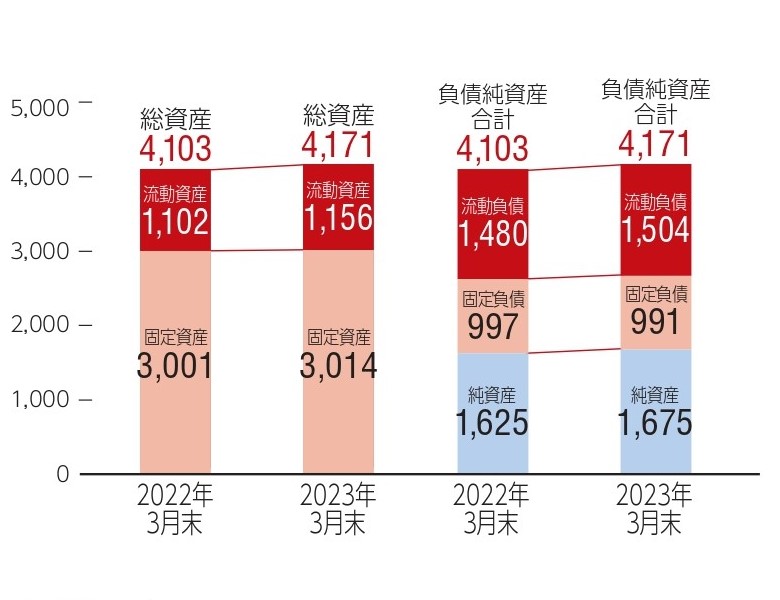
-
キャッシュ・フローの状況(億円)
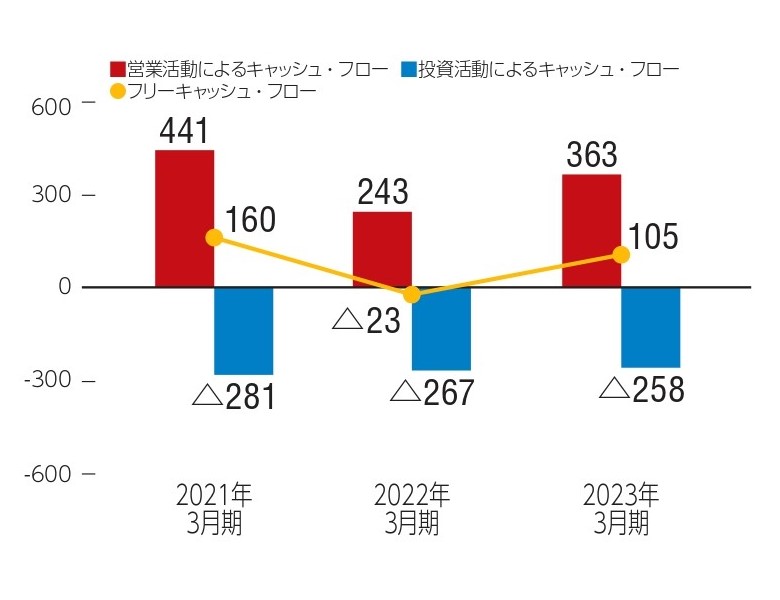
-
ROE・ROA(%)
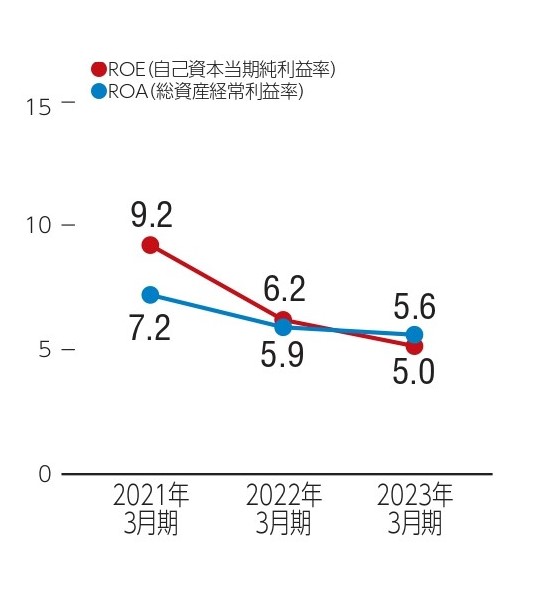
過去5年の業績推移
(単位:100万円)
| 2019年 3月期 |
2020年 3月期 |
2021年 3月期 |
2022年 3月期 |
2023年 3月期 |
|
|---|---|---|---|---|---|
| 営業収益 | 565,931 | 678,096 | 730,168 | 732,519 | 759,977 |
| 営業利益 | 14,210 | 15,515 | 25,648 | 21,205 | 20,062 |
| 経常利益 | 16,091 | 16,878 | 28,397 | 24,140 | 23,049 |
| 親会社株主に帰属する当期純利益 | 7,910 | 6,477 | 12,592 | 9,014 | 7,603 |
| 総資産 | >311,813 | 383,919 | 404,458 | 410,365 | 417,107 |
| 純資産 | 125,395 | 140,645 | 155,190 | 162,521 | 167,520 |
| 株主資本 | 124,599 | 130,748 | 142,862 | 148,156 | 152,408 |
| 有利子負債 | 96,717 | 124,872 | 120,884 | 125,456 | 118,780 |
| 営業活動によるキャッシュフロー | 27,369 | 30,871 | 44,138 | 24,361 | 36,397 |
| 投資活動によるキャッシュフロー | -31,621 | -26,615 | -28,137 | -26,729 | -25,885 |
| フリーキャッシュフロー | -4,252 | 4,256 | 16,001 | -2,367 | 10,512 |
| 財務活動によるキャッシュフロー | 7,302 | -551 | -10,472 | -4,115 | -12,349 |
| 現金及び現金同等物の増加額 | 2,999 | 3,217 | 5,190 | -6,482 | -1,894 |
| 現金及び現金同等物の期末残高 | 17,938 | 24,159 | 29,349 | 22,867 | 20,973 |
| 設備投資(支払ベース) | 26,878 | 32,138 | 32,832 | 30,947 | 25,995 |
| 減価償却費(CF) | 15,163 | 17,665 | 18,234 | 20,228 | 20,691 |
| 1株当たり純資産(円) | 2,320.53 | 2,435.06 | 2,660.56 | 2,766.89 | 2,851.73 |
| 1株当たり当期純利益(円) | 153.06 | 120.63 | 234.52 | 167.87 | 141.61 |
| 1株当たり年間配当金(円) | 48 | 52 | 54 | 56 | 58 |
| 配当性向 | 31.4% | 43.1% | 23.0% | 33.4% | 41.0% |
| 自己資本当期利益率(ROE) | 6.7% | 5.1% | 9.2% | 6.2% | 5.0% |
| 自己資本比率 | 40.0% | 34.1% | 35.3% | 36.2% | 36.6% |
| デット・エクイティ・レシオ | 0.8 | 0.9 | 0.8 | 0.8 | 0.7 |
| 総資産経常利益率(ROA) | 5.4% | 4.9% | 7.2% | 5.9% | 5.6% |
